
Port / PID / app / project
See listeners
Search Windows TCP listeners by port, application, PID, project, and Session.
A Windows port-inspector plugin for DeepSeek Harness DSH Web
In the DeepSeek Harness DSH Web UI, see who is listening, which Session started it, and whether the port was actually released after handling.
Windows / DSH Web / TCP listeners
Why it exists
Task Manager can show a PID. DSH can manage Jobs and Terminals. What is missing is a chain you can verify between the two.
Port Inspector brings the Windows listener snapshot and DSH launch evidence into one view.
Capabilities
It is not a general task manager. It is a DeepSeek Harness runtime inspection and local port-origin tool for Coding Agent workflows.
Search Windows TCP listeners by port, application, PID, project, and Session.
Match the Windows parent chain to a DSH root process. Only complete evidence earns “Started by DSH”.
Managed Jobs and Terminals use DSH lifecycle APIs. External handling is limited to one identity-verified PID.
Run a fresh scan after every action and report whether the target port was actually released.
How it works
From the Windows listener to the DSH Tool Call, each step remains understandable and reviewable.
Read current TCP listeners and record the address, port, PID, application, and creation time.
Observe the root process created by DSH and keep PID plus creation time to guard against PID reuse.
Walk the parent chain and connect the listener back to its DSH Session, Turn, Step, and Tool Call.
Review the project, origin, and handling mode before stopping a managed resource or ending one external PID.
Scan again after handling to confirm the target port is released while other services remain intact.
Product evidence
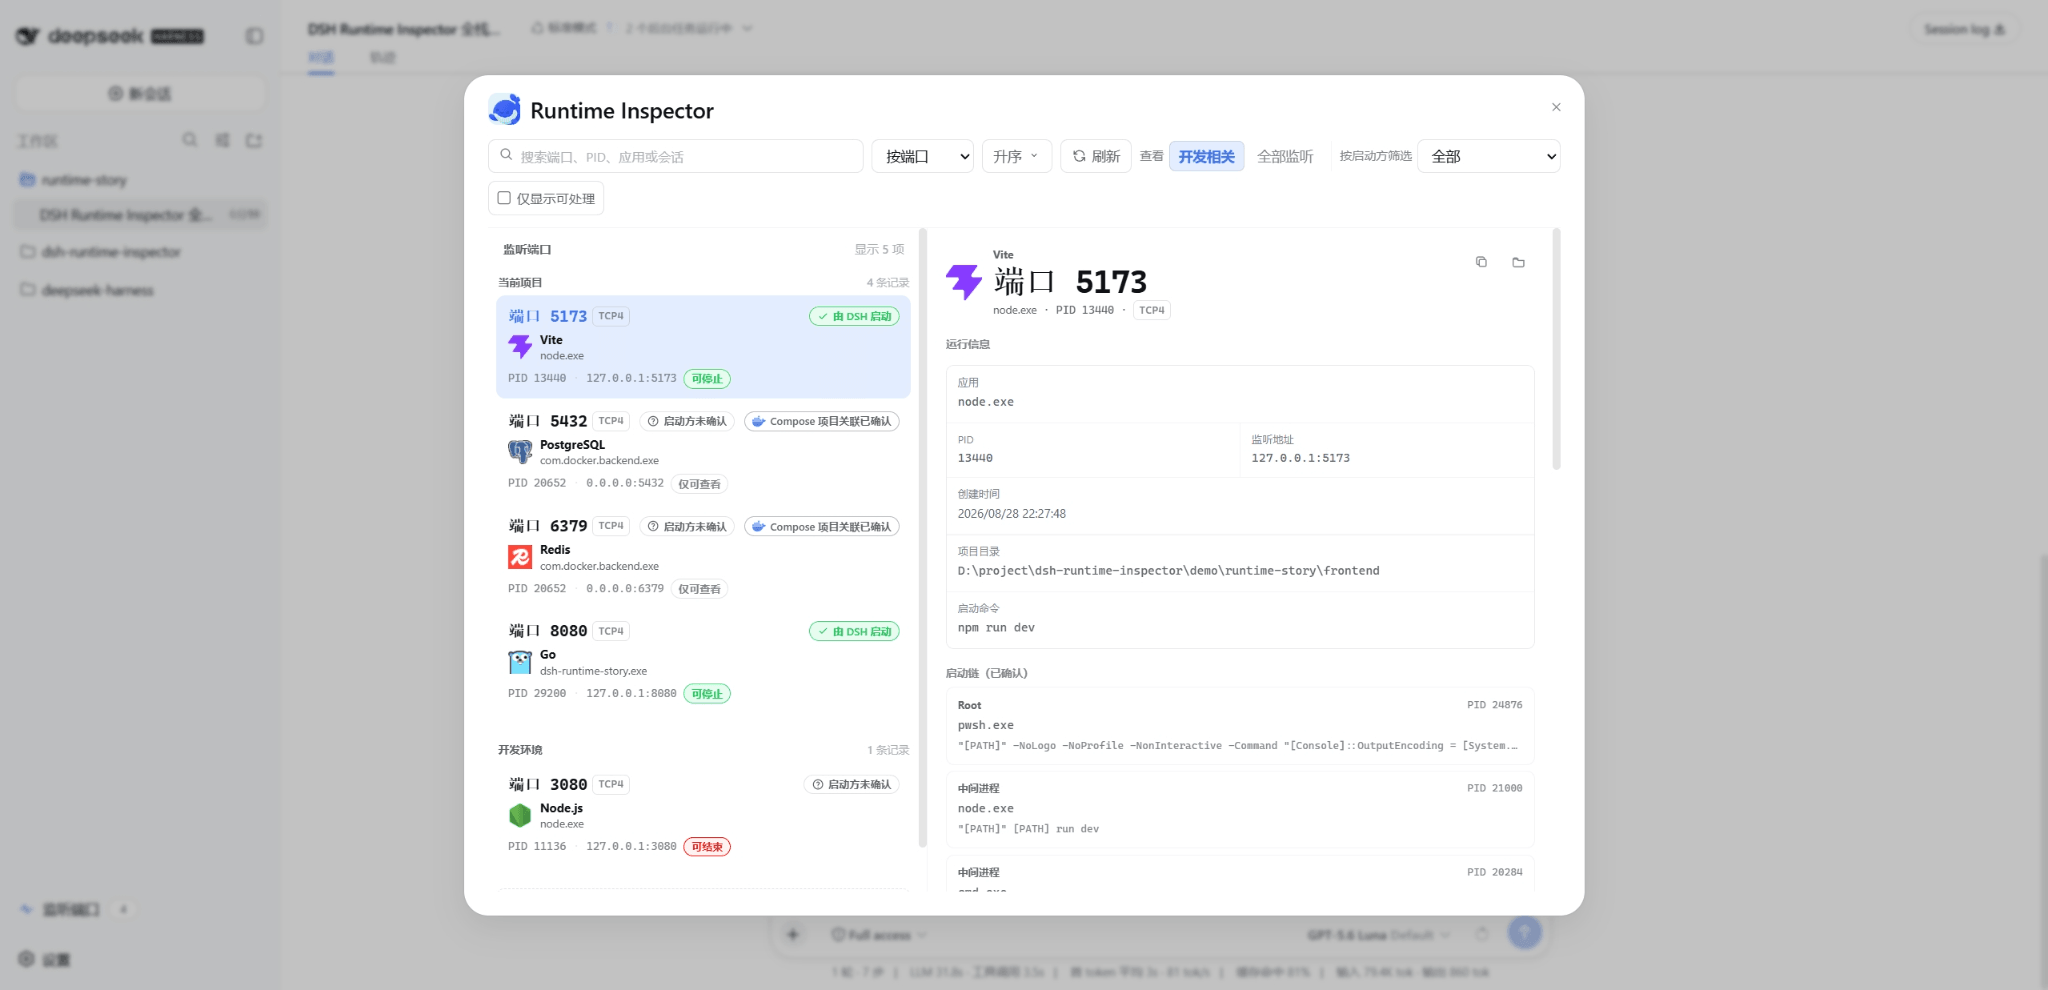
The real interface shows the port, project, starter, and handling mode. Each state answers a different question.
“Started by DSH” describes origin evidence. “Can stop” describes the available lifecycle handling path.
The UI prioritizes the current project and identified development toolchains while keeping other listeners searchable.
Incomplete origin evidence or permissions keep the record visible, but the handling capability stays read-only.
Safety boundary
Safe handling is a boundary defined by evidence, permissions, and user confirmation, not a hidden shortcut.
The port list is for diagnosis. Models can read bounded, redacted information, but cannot terminate through the Tool.
Before termination, verify PID, creation time, and executable. If the target changes, refuse the action.
Handle one explicitly selected target at a time. Never kill an external process tree or elevate automatically.
System, protected, other-user, or insufficiently identified targets remain view-only.
It is not a general task manager, and it does not label every still-useful background service as a leak.
Support scope
The first release focuses on one frequent, real-world path: multiple local services running in DSH Web on Windows.
The first release targets Windows local execution and TCP listeners.
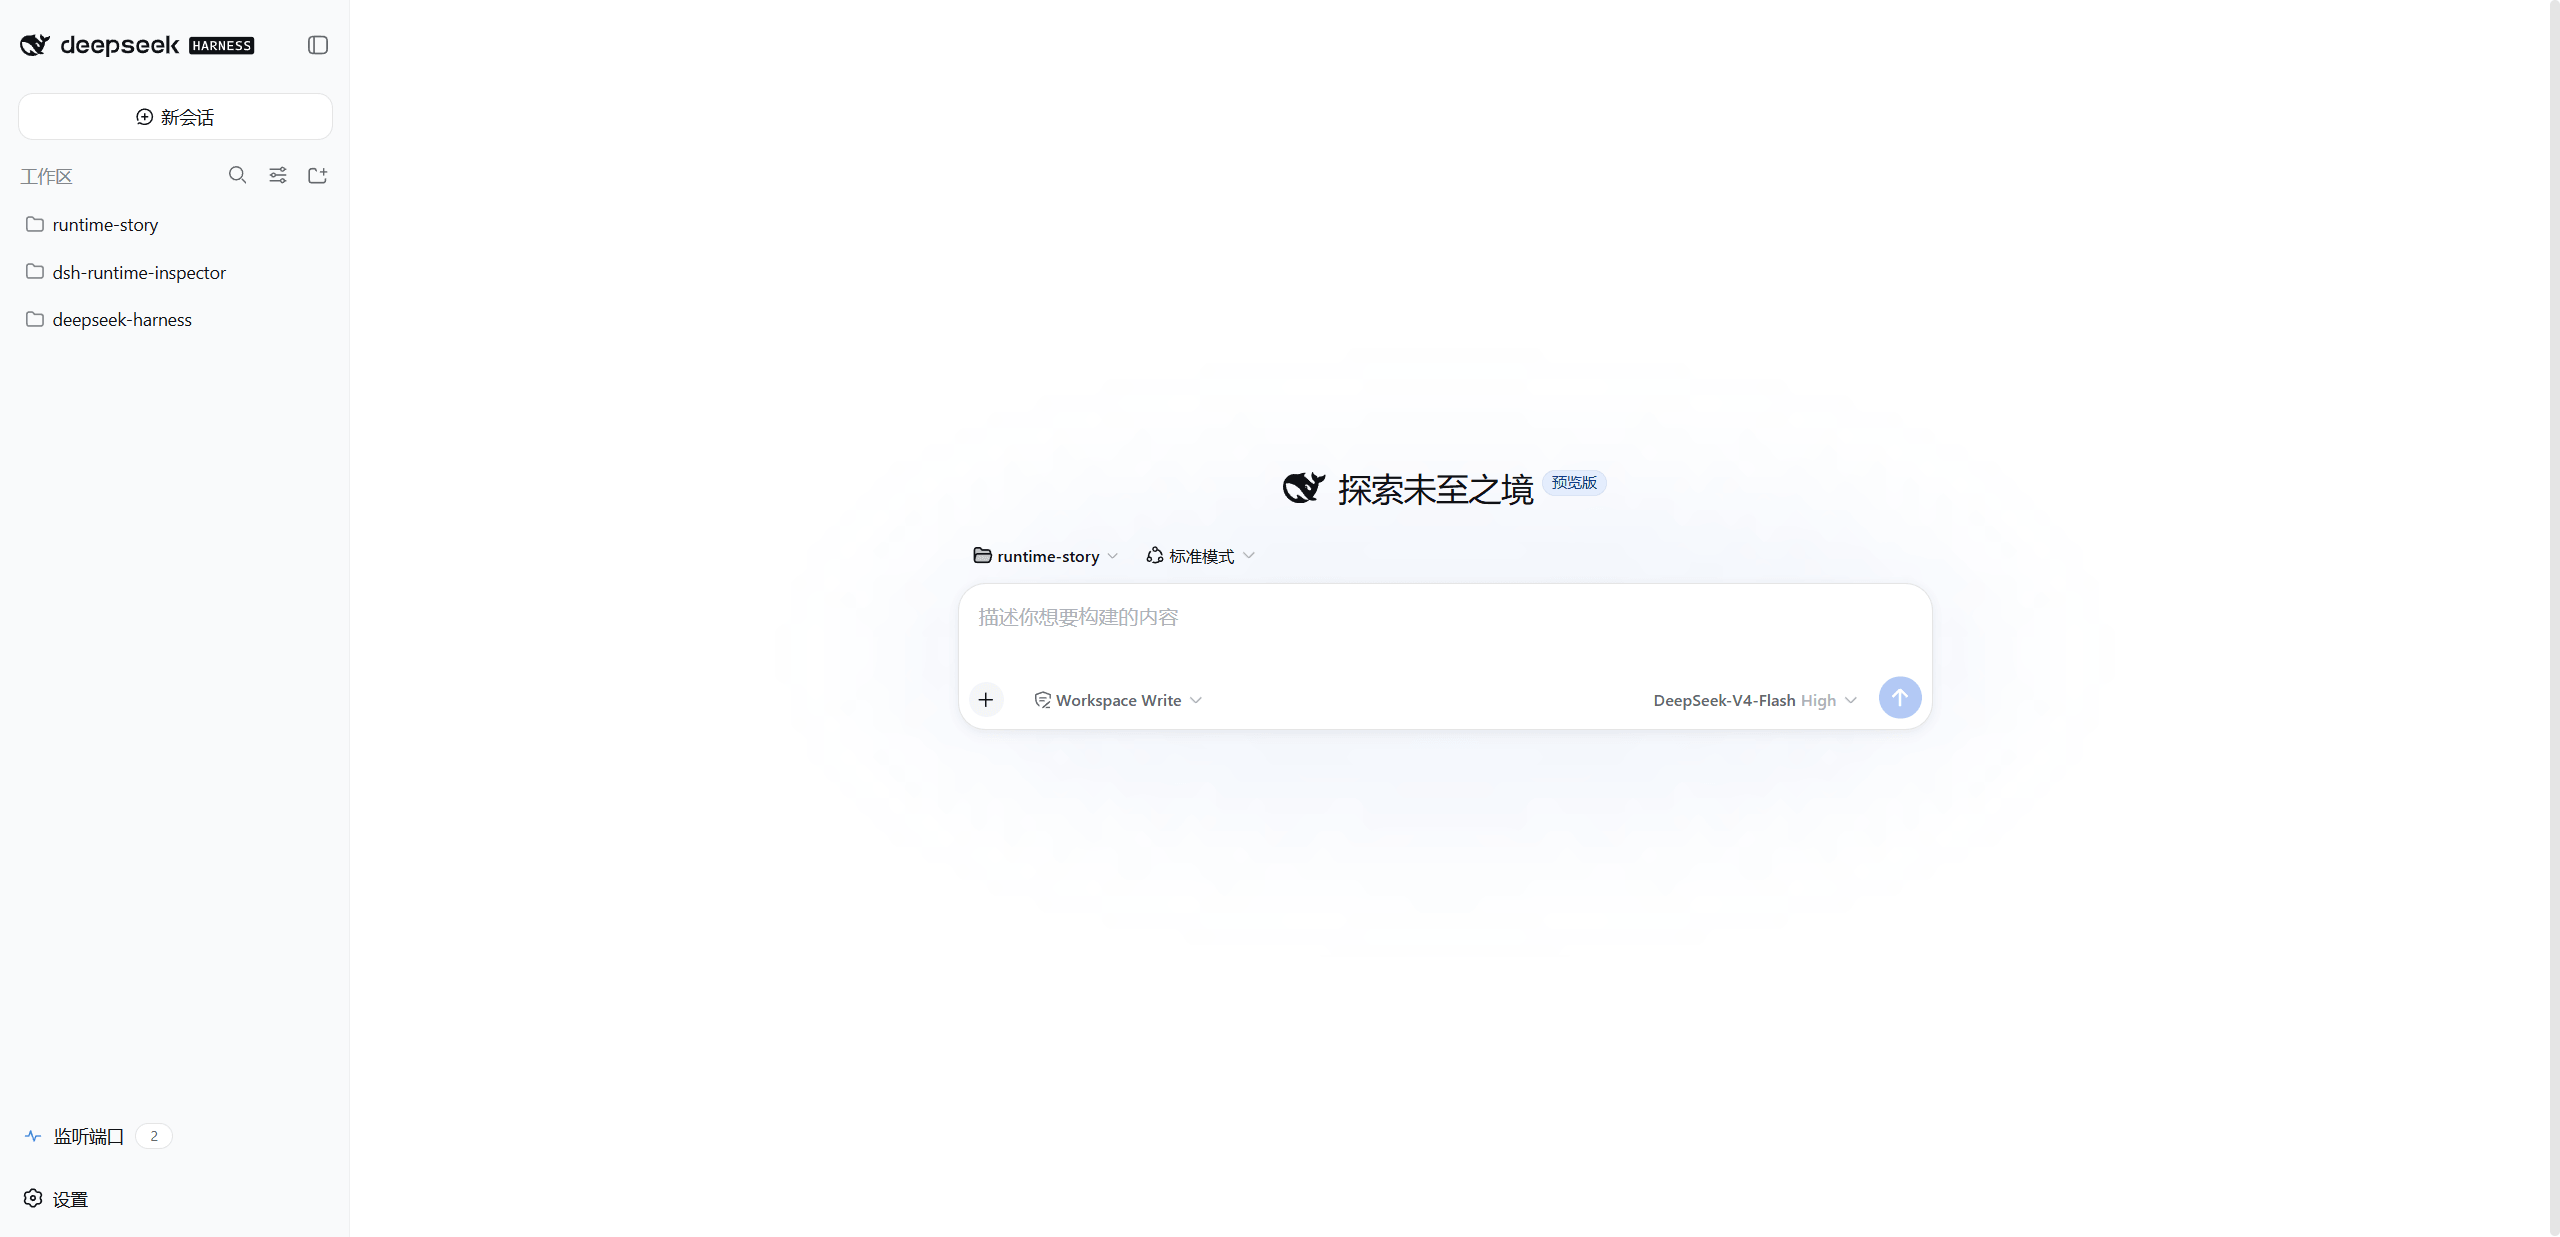
Install as a standard Bundle and open Port Inspector from the Web sidebar.
Useful for local Vite, Node.js, Go, Python, and Docker Compose services.
Get started
Install this DSH Web plugin, restart the target DeepSeek Harness Web Profile, then open Port Inspector from the sidebar.
Restart the target Profile after installing or updating the Bundle. Origin records begin with the new DSH runtime cycle.
dsh plugin --profile web add dsh-port-inspector@latest RequirementsWindows / Node.js >= 22.19.0 / DSH Web Profile
FAQ
Port Inspector is a Windows local development port-inspection plugin for DSH Web. It connects TCP listeners, processes, projects, Sessions, and Tool Calls in one reviewable origin chain.
No. Port Inspector is read-only by default. Handling starts only after an explicit selection and identity recheck.
The Windows MVP does not target macOS, Linux, UDP, remote hosts, cross-restart history, bulk termination, or automatic governance.
The listener can still be shown. Its starter becomes unconfirmed, and insufficient permissions or identity keep handling view-only.
No. It works as the Host and Browser halves of a standard DSH Bundle without starting a second companion Web service.